Product Value Evaluation Tool
Helping shoppers evaluate product value on the Amazon product page
Overview
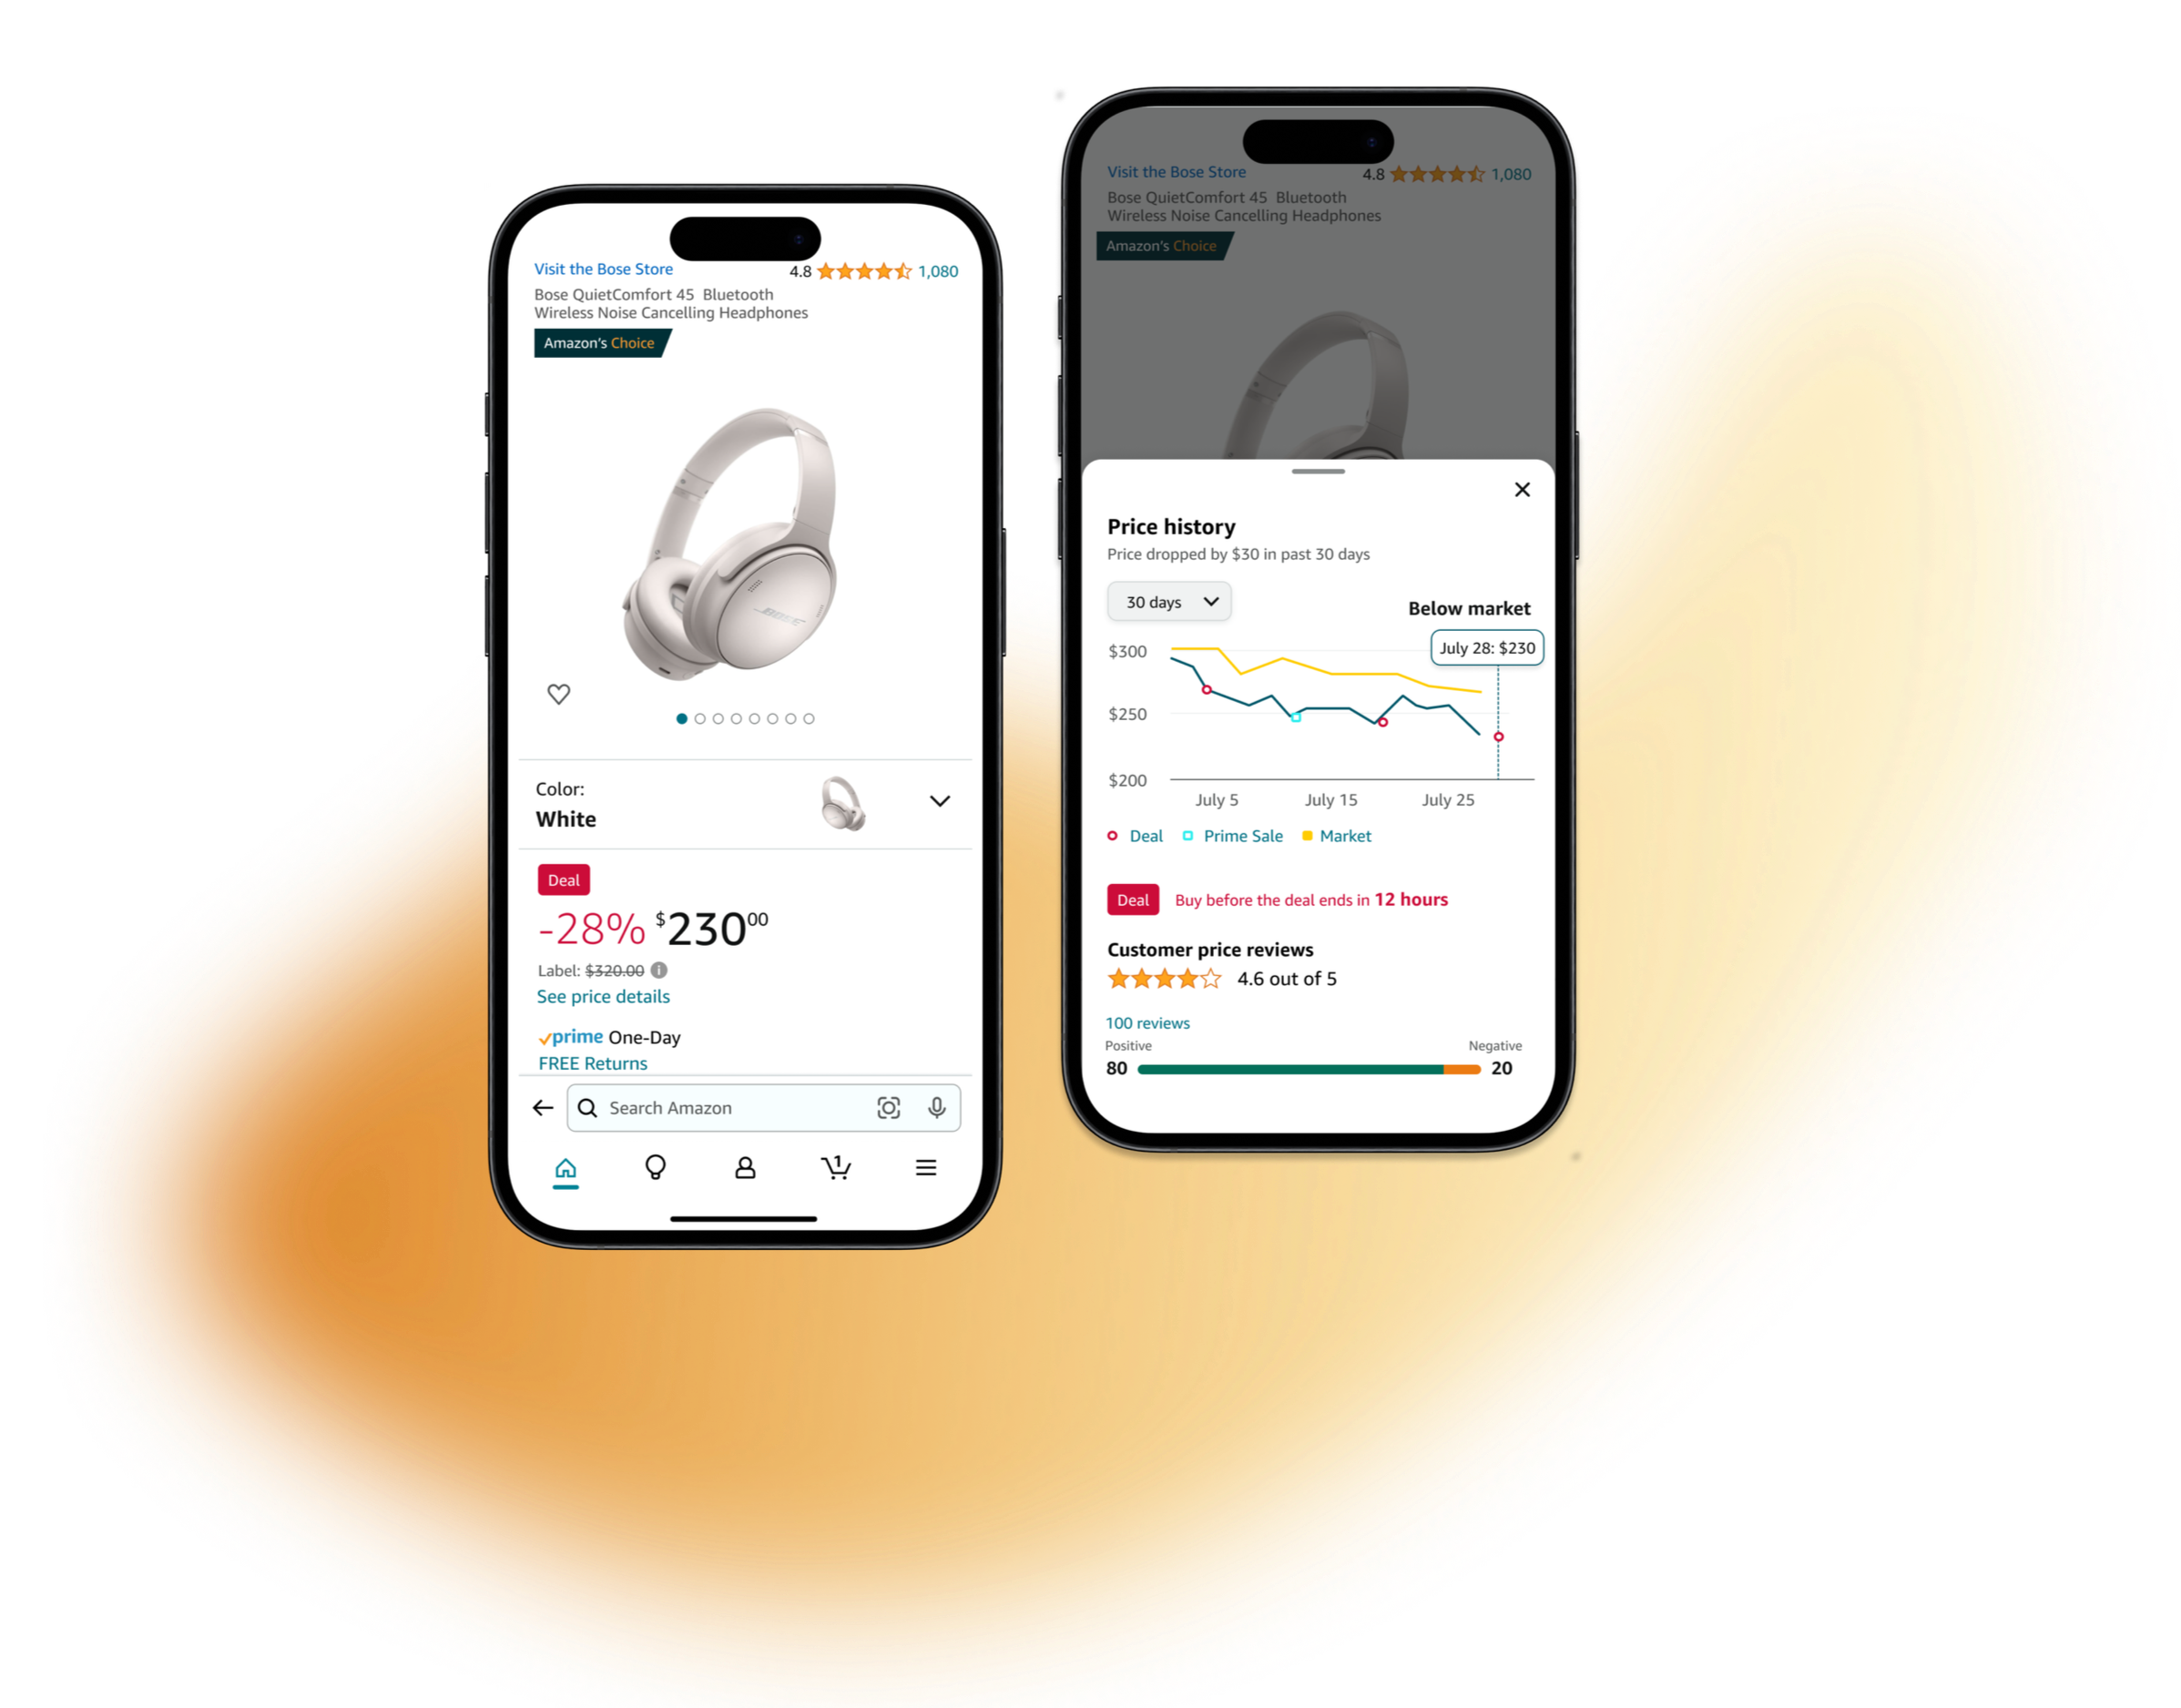
As a UX designer, I designed a new price evaluation pattern for the product details page for Amazon shopping app. The goal was to give shoppers enough price context to feel confident about their purchase without leaving the page.
Team
Project manager
Sr. UX Designer
Tools
Figma, UserTesting
My Role
UX Designer
Duration
3 months
Background
Our internal research showed that about 40% of shoppers left the product detail page without continuing their shopping journey.
Objective
Discover the root causes of product detail page abandonment and define a design strategy that improves user decision-making and drives conversion.
Proposed Solutions
I designed a set of Price Evaluation UI patterns that surface key price context directly on the PDP. The patterns combine market trends, deal information, and customer feedback so shoppers can evaluate value quickly and decide with confidence.
Key features
1. Price Tracker Tool: Shows recent price trends and Amazon price history so customers can quickly compare and spot unusual changes.
2. Time-Limited Deal Alert: Highlights time-sensitive deals and how much customers save within the current window.
3. Positive and Negative Review Indicator: Surfaces how many reviews mention price/value positively vs. negatively, to increase transparency and trust.
4. Categorized price review buttons: Groups reviews by price-related topics for faster scanning.
5. AI-generated review summary: Provides concise summaries of price-related reviews for the selected topic, reducing reading time.
DESIGN PROCESS
This project followed an iterative design process starting from exploratory research, synthesizing user insights, prototyping two design variations, and validating them through A/B testing.

Discovery through research data
Customer price evaluation behavior
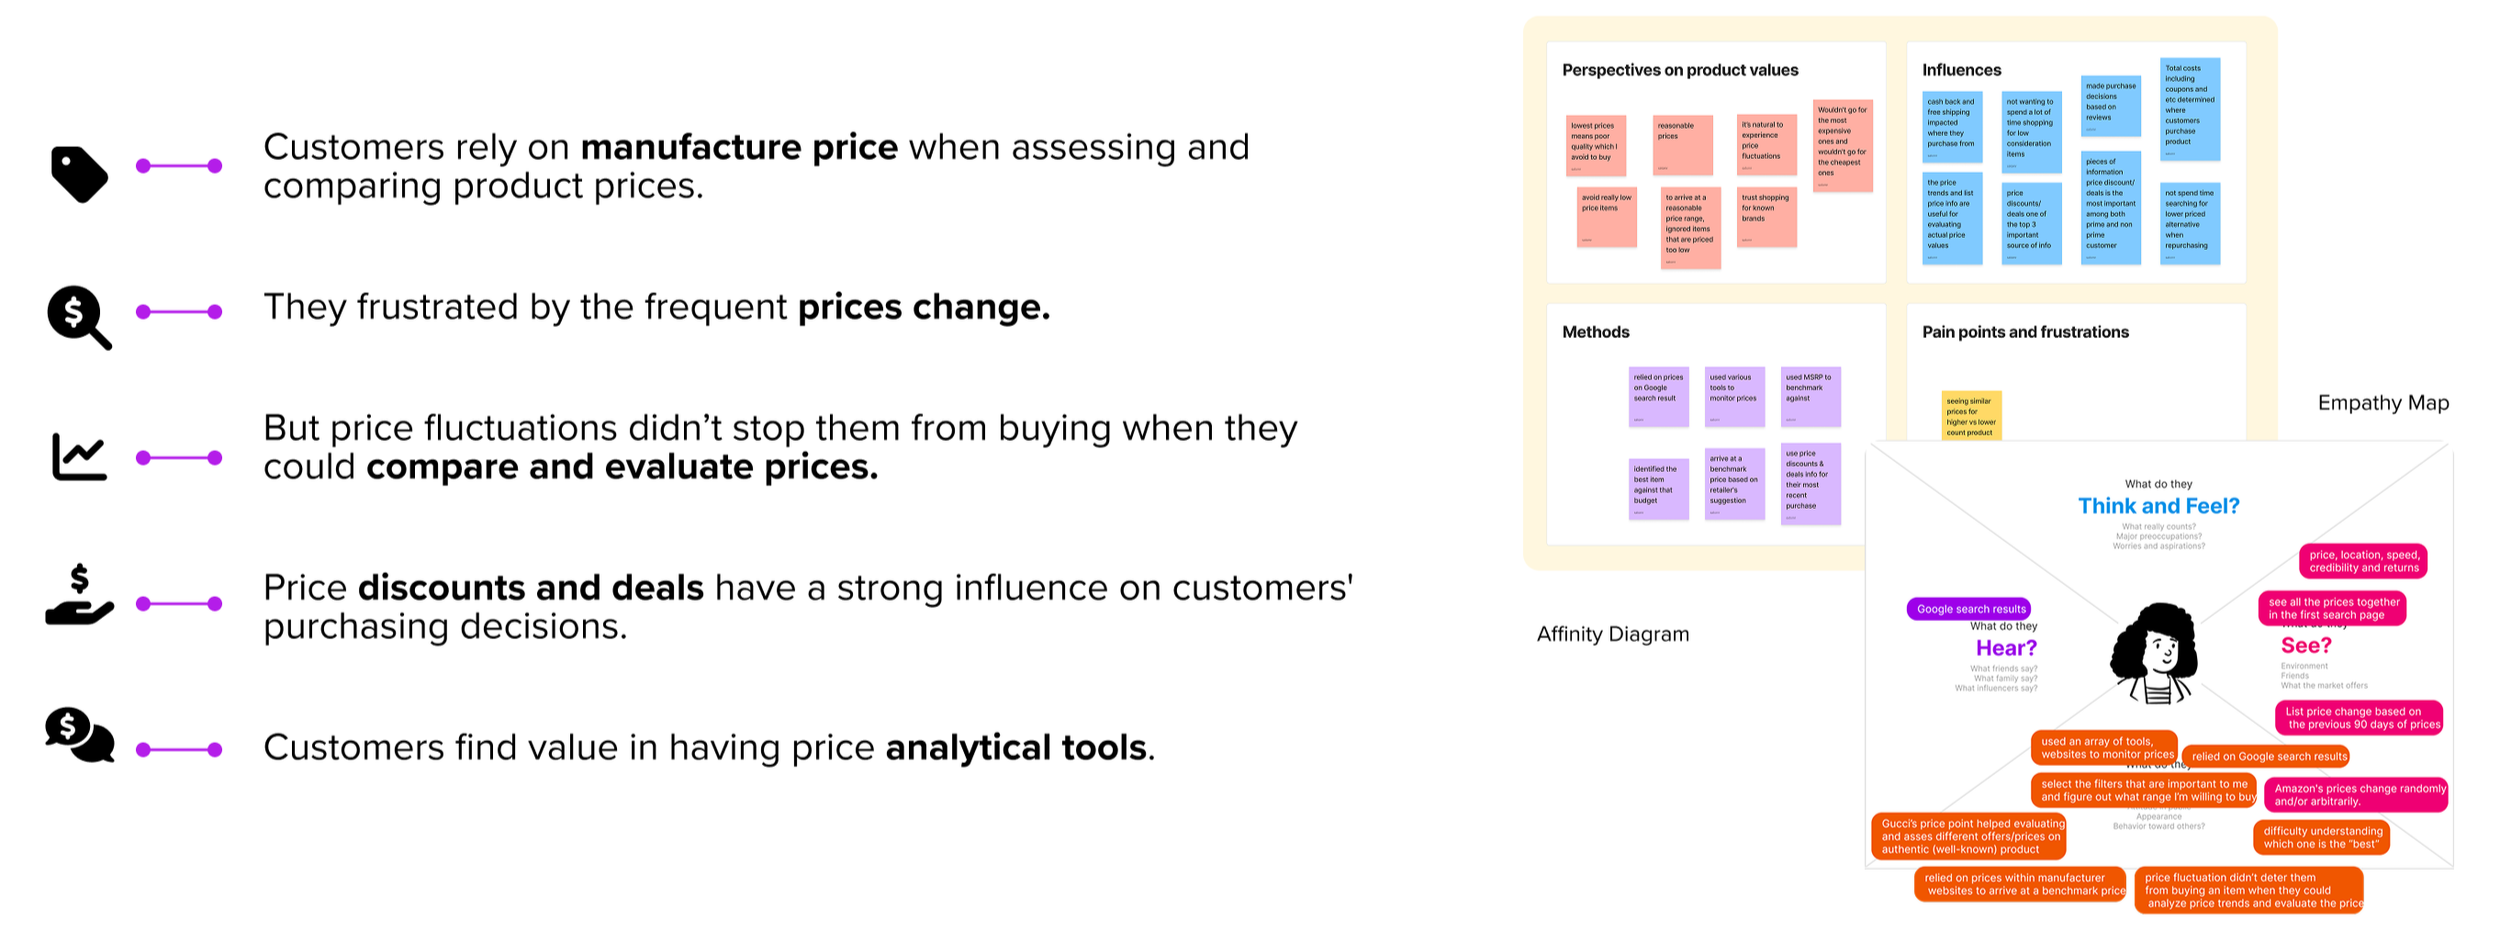
To understand how shoppers evaluate product value, I evaluated findings from multiple existing Amazon Shopping research studies on price perception and purchase confidence.
How do shoppers determine the value for an item?

What influences customers’ purchasing decisions?

Synthesizing insights
To narrow down potential solutions, I used quick mind mapping to explore different ways of supporting price evaluation. From this exercise, I decided to focus on features that make it easy for customers to evaluate prices directly on the PDP and increase their confidence before purchasing.
Design exploration
First round design variations
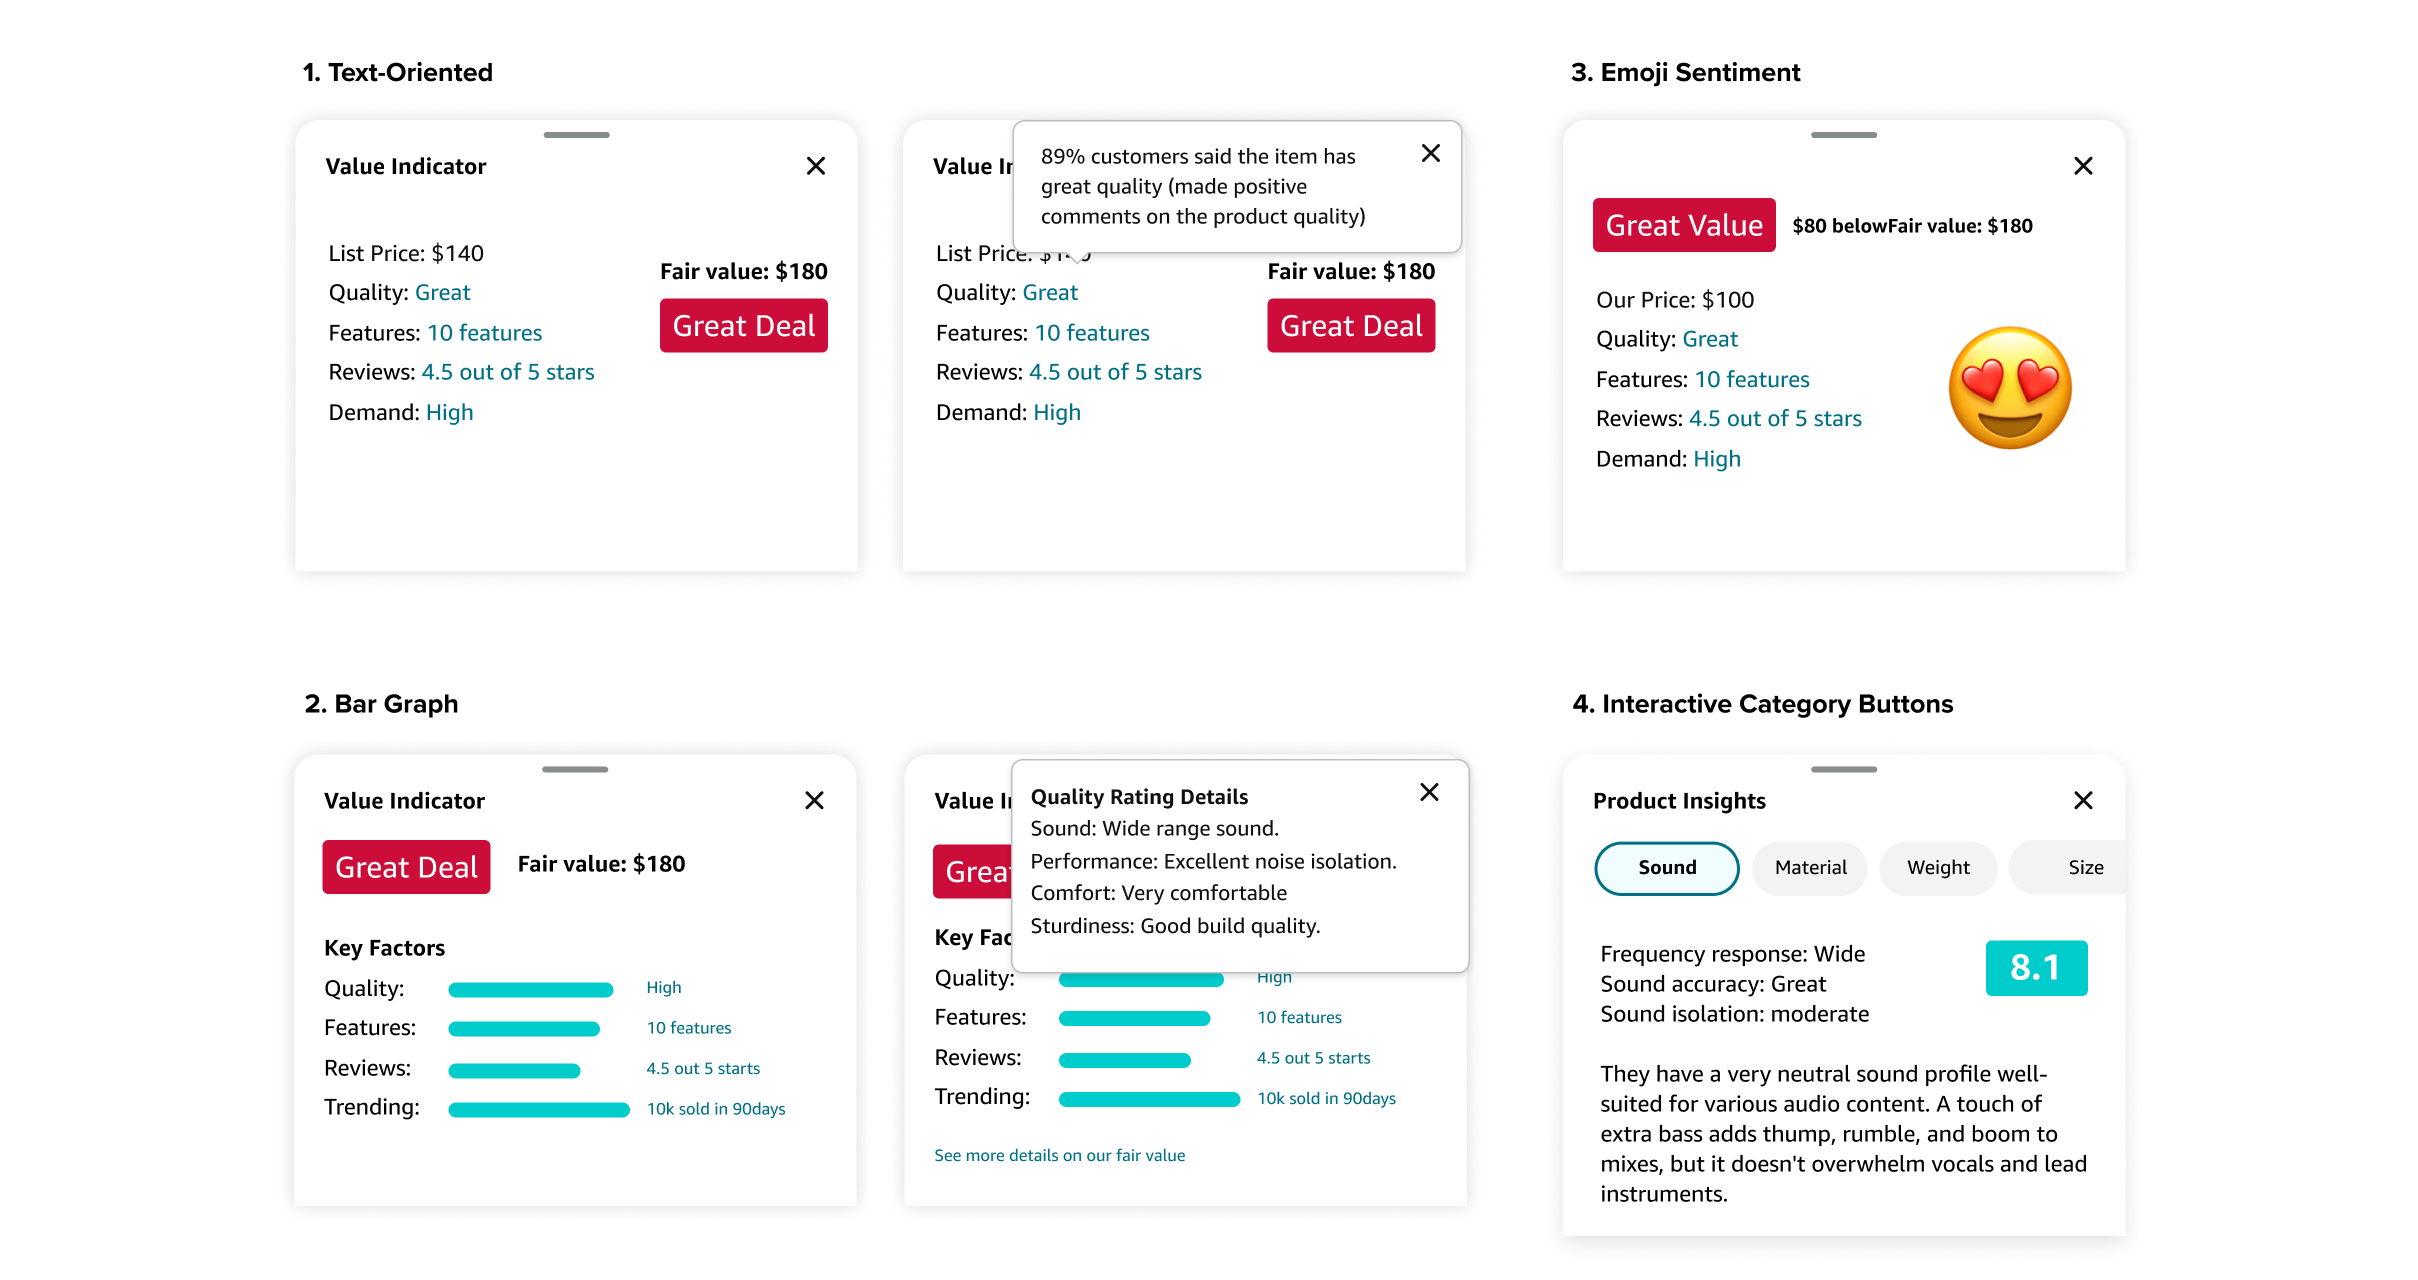
For the first exploration, I focused on a “value indicator” concept that could help customers quickly assess a product’s value based on list price, quality signals, feature set, and demand. I created several variations to test which format best balanced clarity, density, and visual noise.
Text-Oriented: Focused on textual descriptions without visual elements.
Bar Graph: Features bar graphs to visually represent key value components.
Emoji Sentiment: Incorporating an emoji to represent the overall sentiment of the product’s evaluation.
Category Buttons: Features interactive buttons for categories like sound, material, weight, and size.
Second round exploration
After reviewing the first round of concepts with my mentor and PM, I refined the ideas and narrowed them down to two directions that aligned better with existing PDP patterns and technical feasibility.
Key Components
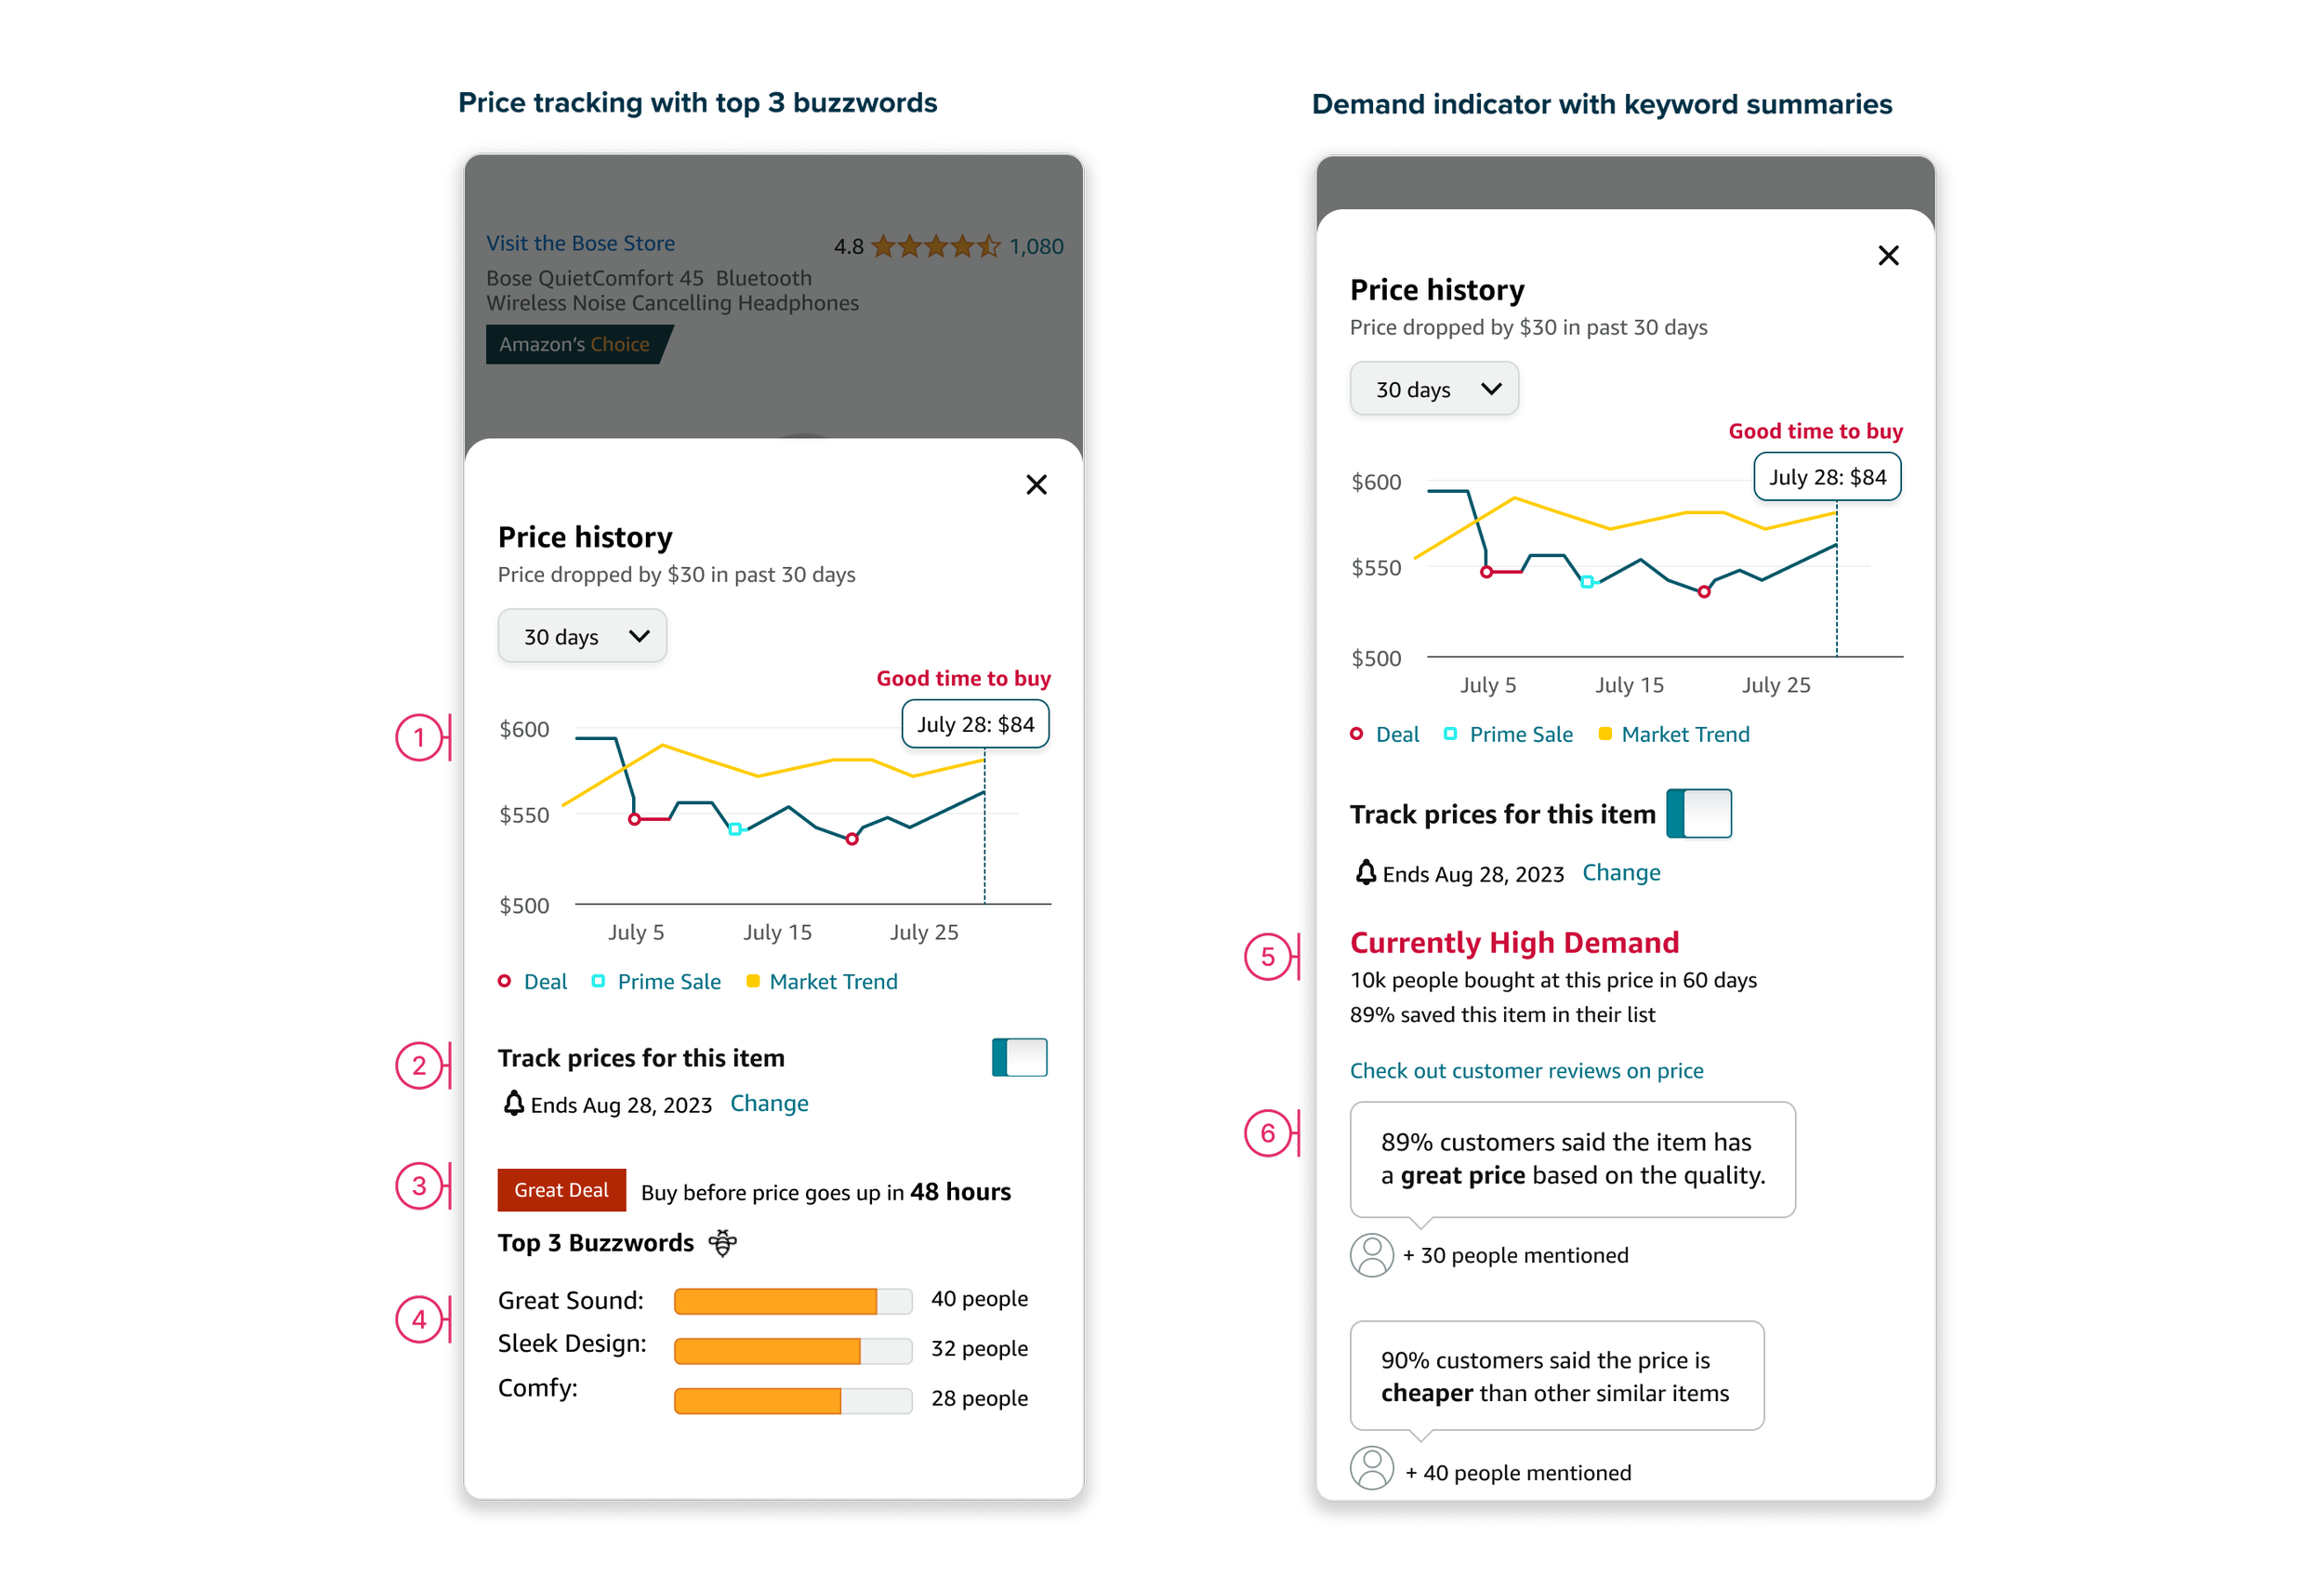
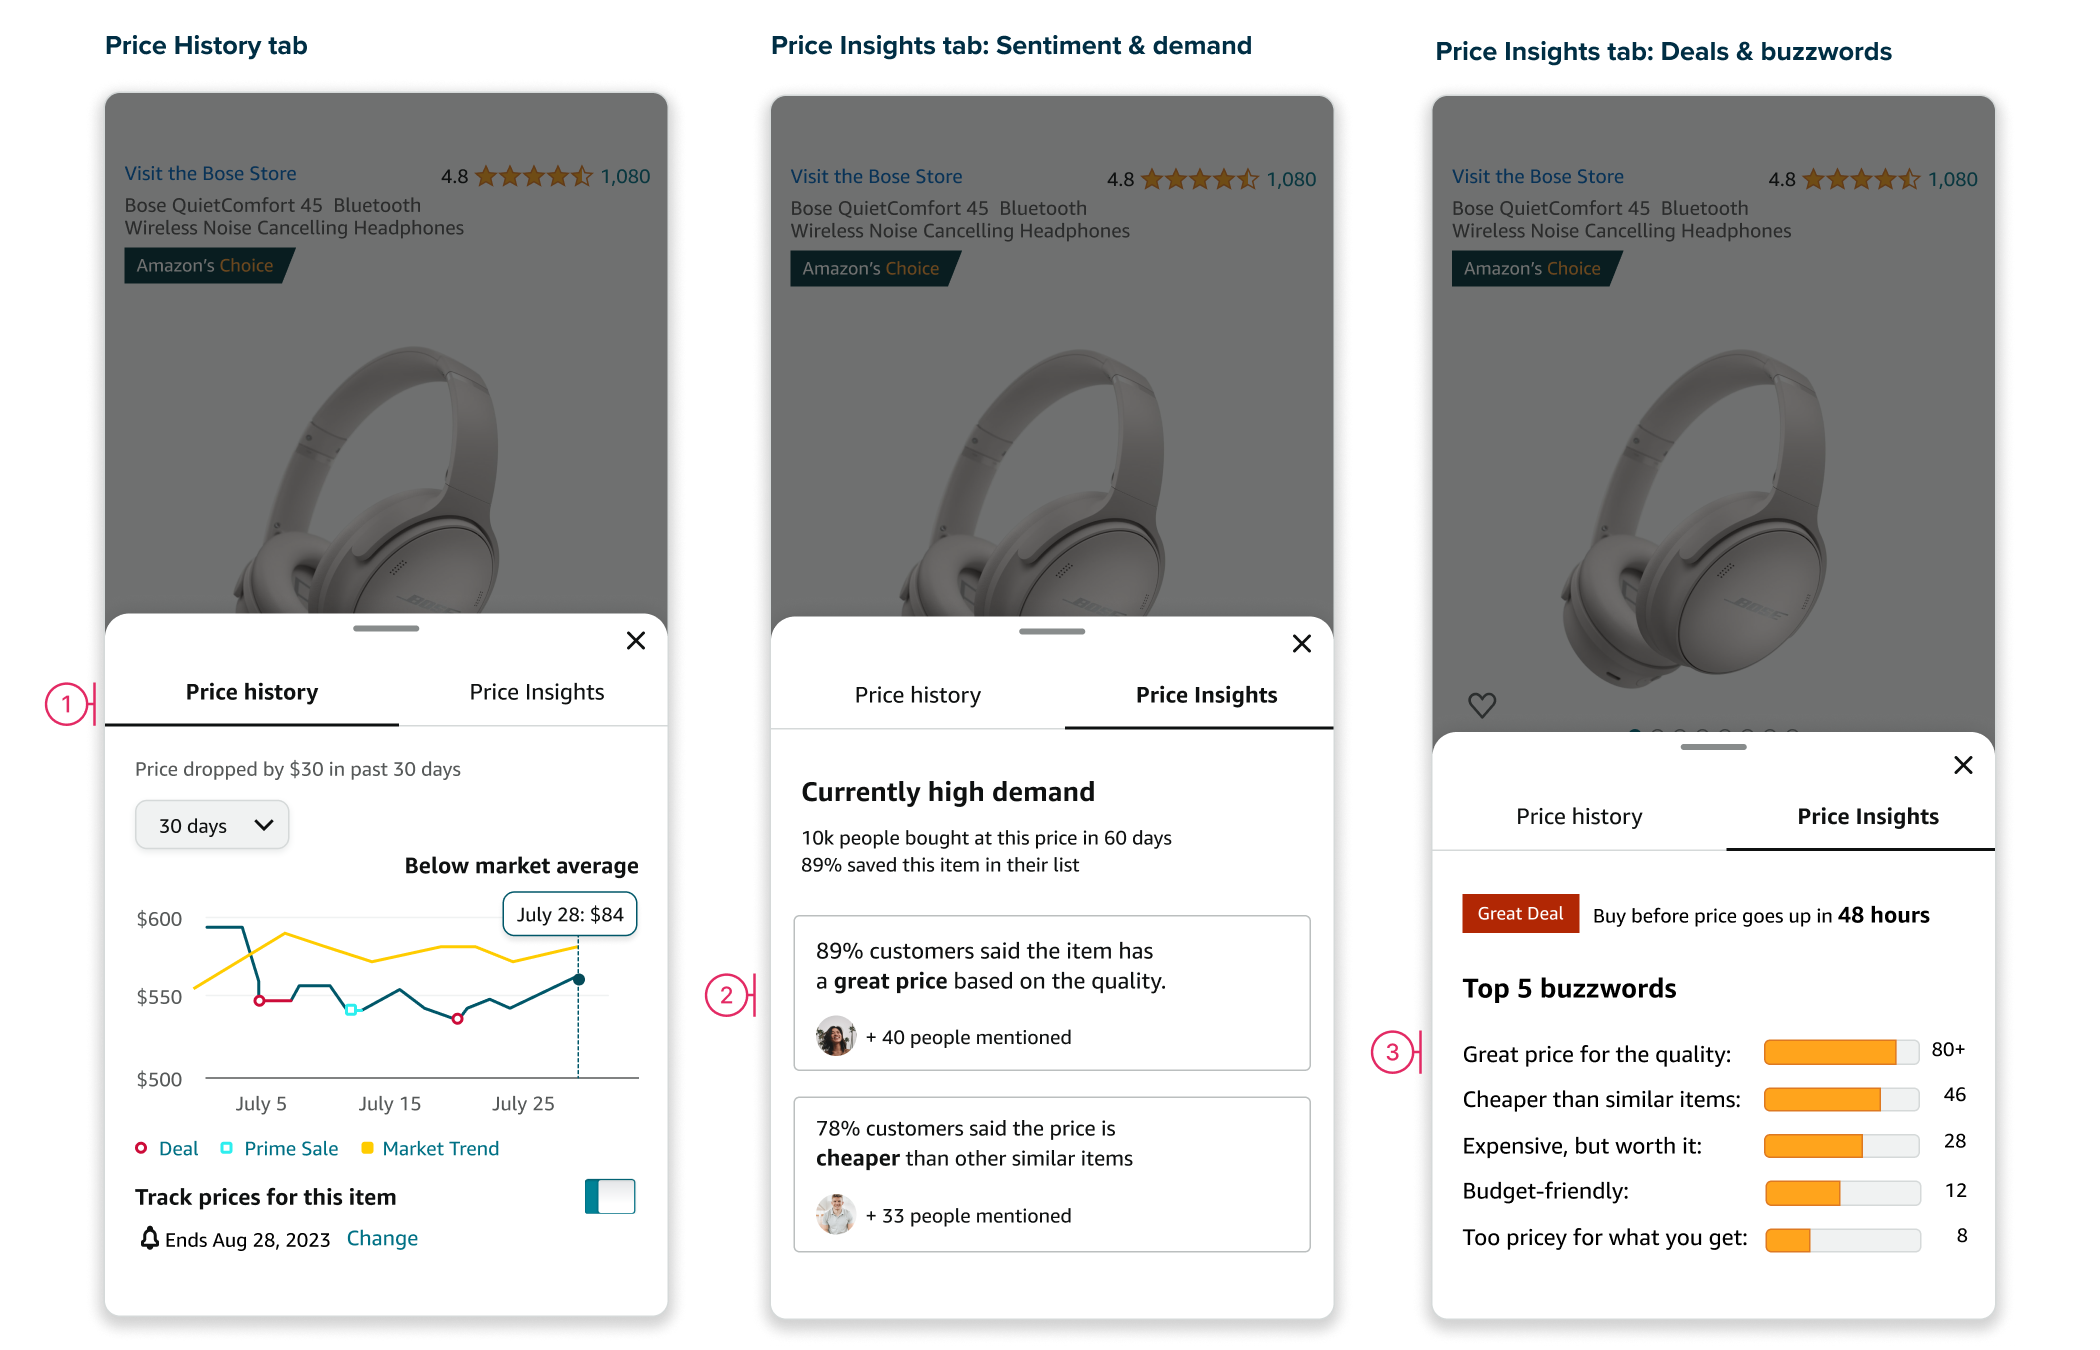
Concept 1: Price tracking with top 3 buzzwords
1. Price tracker visualizes Amazon pricing trends, helping customers find the best time to purchase.
2. Price tracking notification toggle lets customers get alerts when prices drop.
3. Time-sensitive alerts to help customers make timely purchase decisions.
4. Surfaced top 3 buzzwords to help shoppers quickly assess key product qualities.
Concept 2: Demand indicator with key customer sentiments
5. Demand indicator to show purchase trends and help customers make confident buying decisions.
6. Surfacing key customer sentiments to help shoppers make confident, informed decisions.
Further exploration
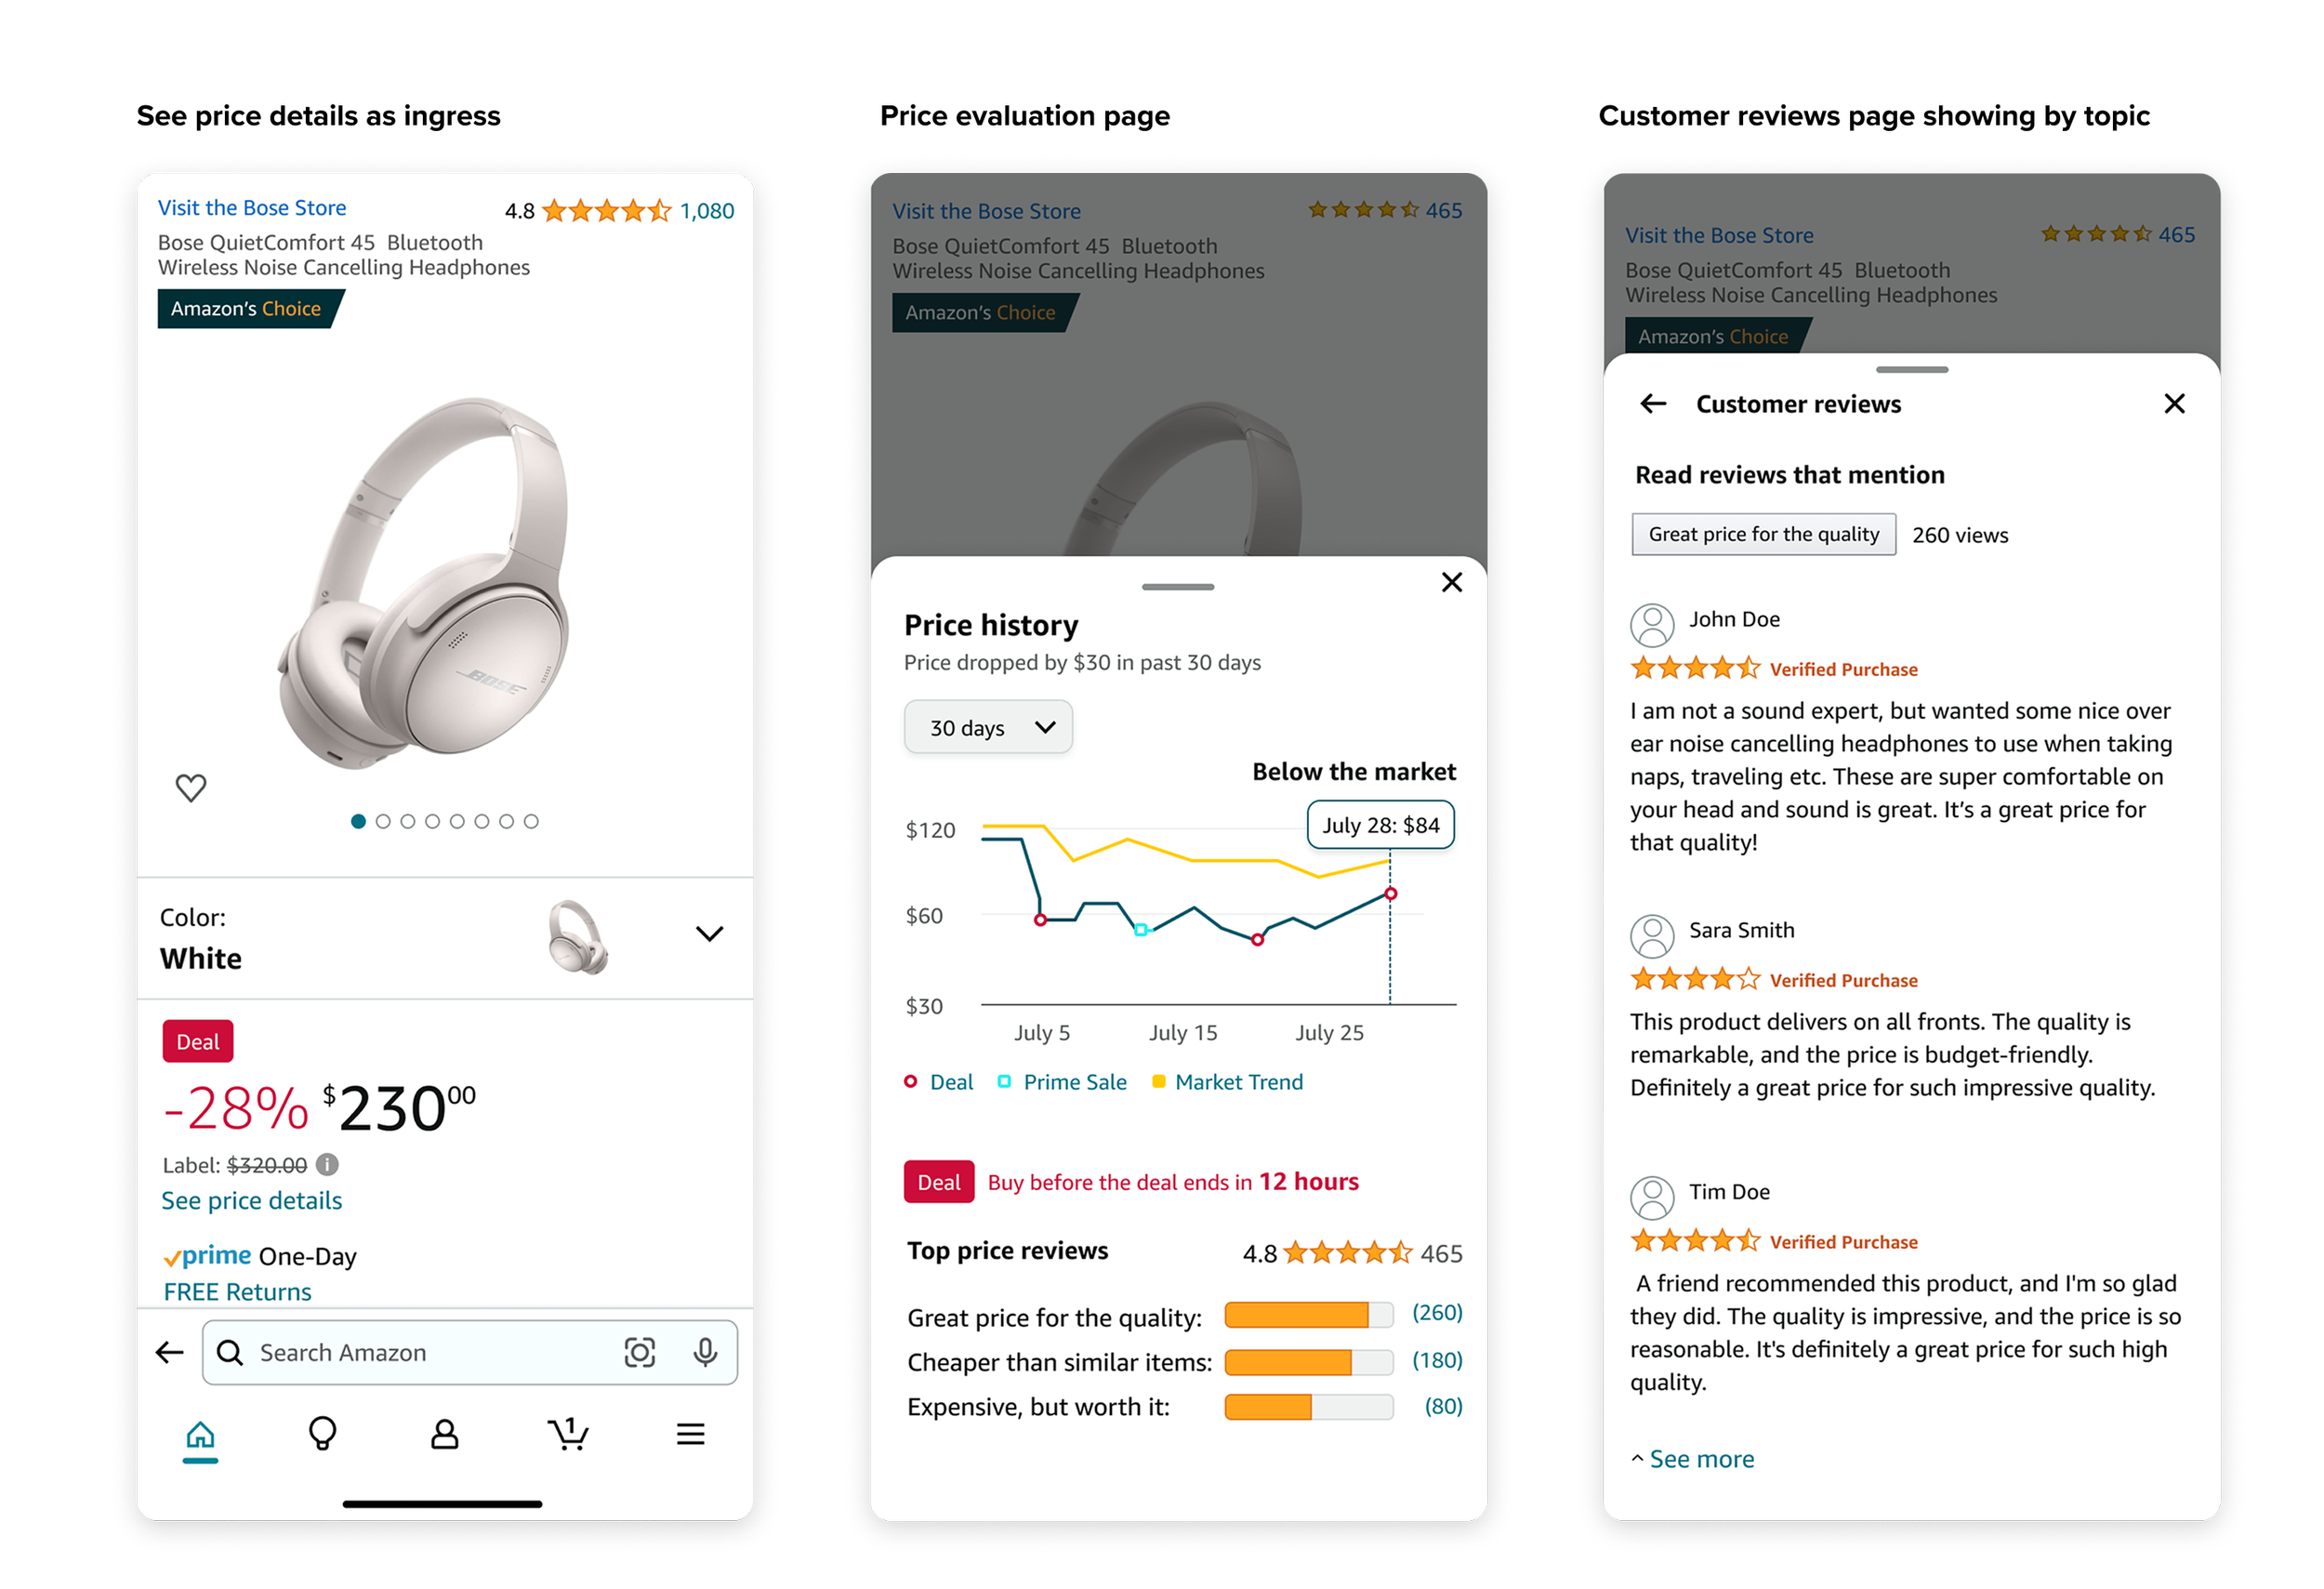
Building on the refined concepts, I explored additional layout and interaction options to improve scannability, conserve vertical space on the PDP, and keep the pattern flexible across different product types.
Key Changes
Added tabs for quick switching between views while saving vertical space
Placed customer price reviews in individual boxes.
Included the top 5 buzzwords with indicators to provide price insights.
Design Validation & Iteration
Initial usability testing
To validate the concepts, I conducted remote usability tests with 8 participants. The goal was to understand how well the patterns communicated price value, which features users relied on most, and where the interface created confusion or distrust.
Key Insights
6/8 participants were more likely to purchase after seeing a time-limited deal alert.
4/8 found top price reviews unhelpful due to subjective tone.
Design Iteration & AB Testing
User testing revealed that price reviews felt too subjective, leading to a design refinement focused on aggregated sentiment data. I then tested two approaches to organizing review sentiment and topics to help customers quickly assess product value without reading individual reviews.
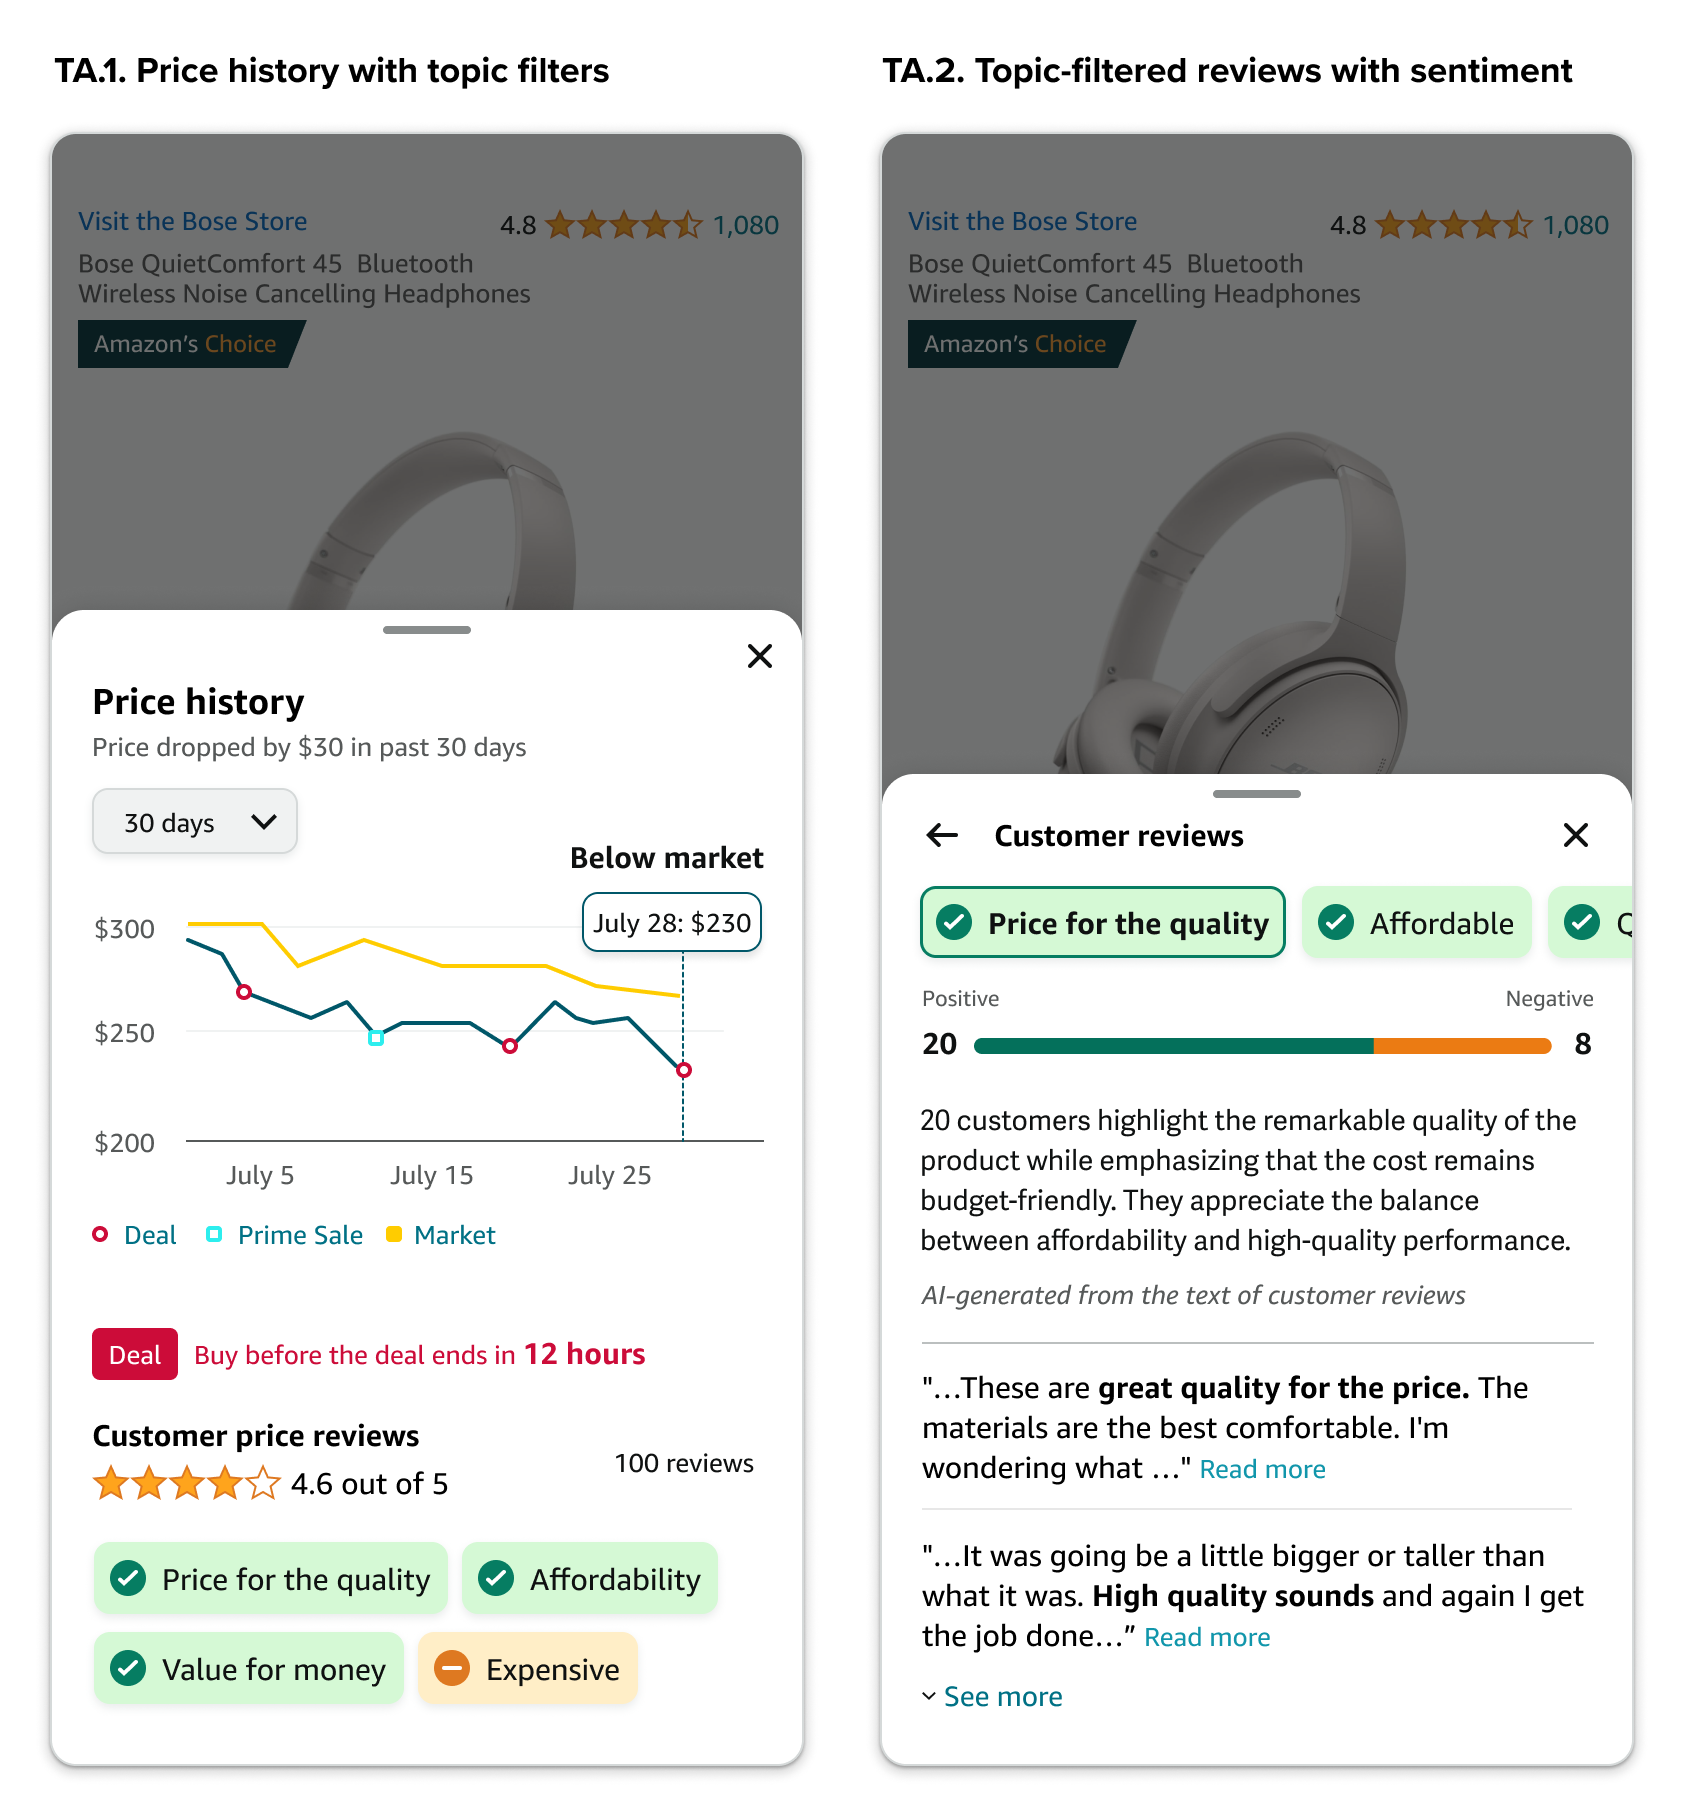
Treatment A
Leading with categorized toggle buttons for topic filtering
Showing positive/negative sentiment breakdown after topic selection
Surfaces AI-generated summaries and corresponding customer reviews
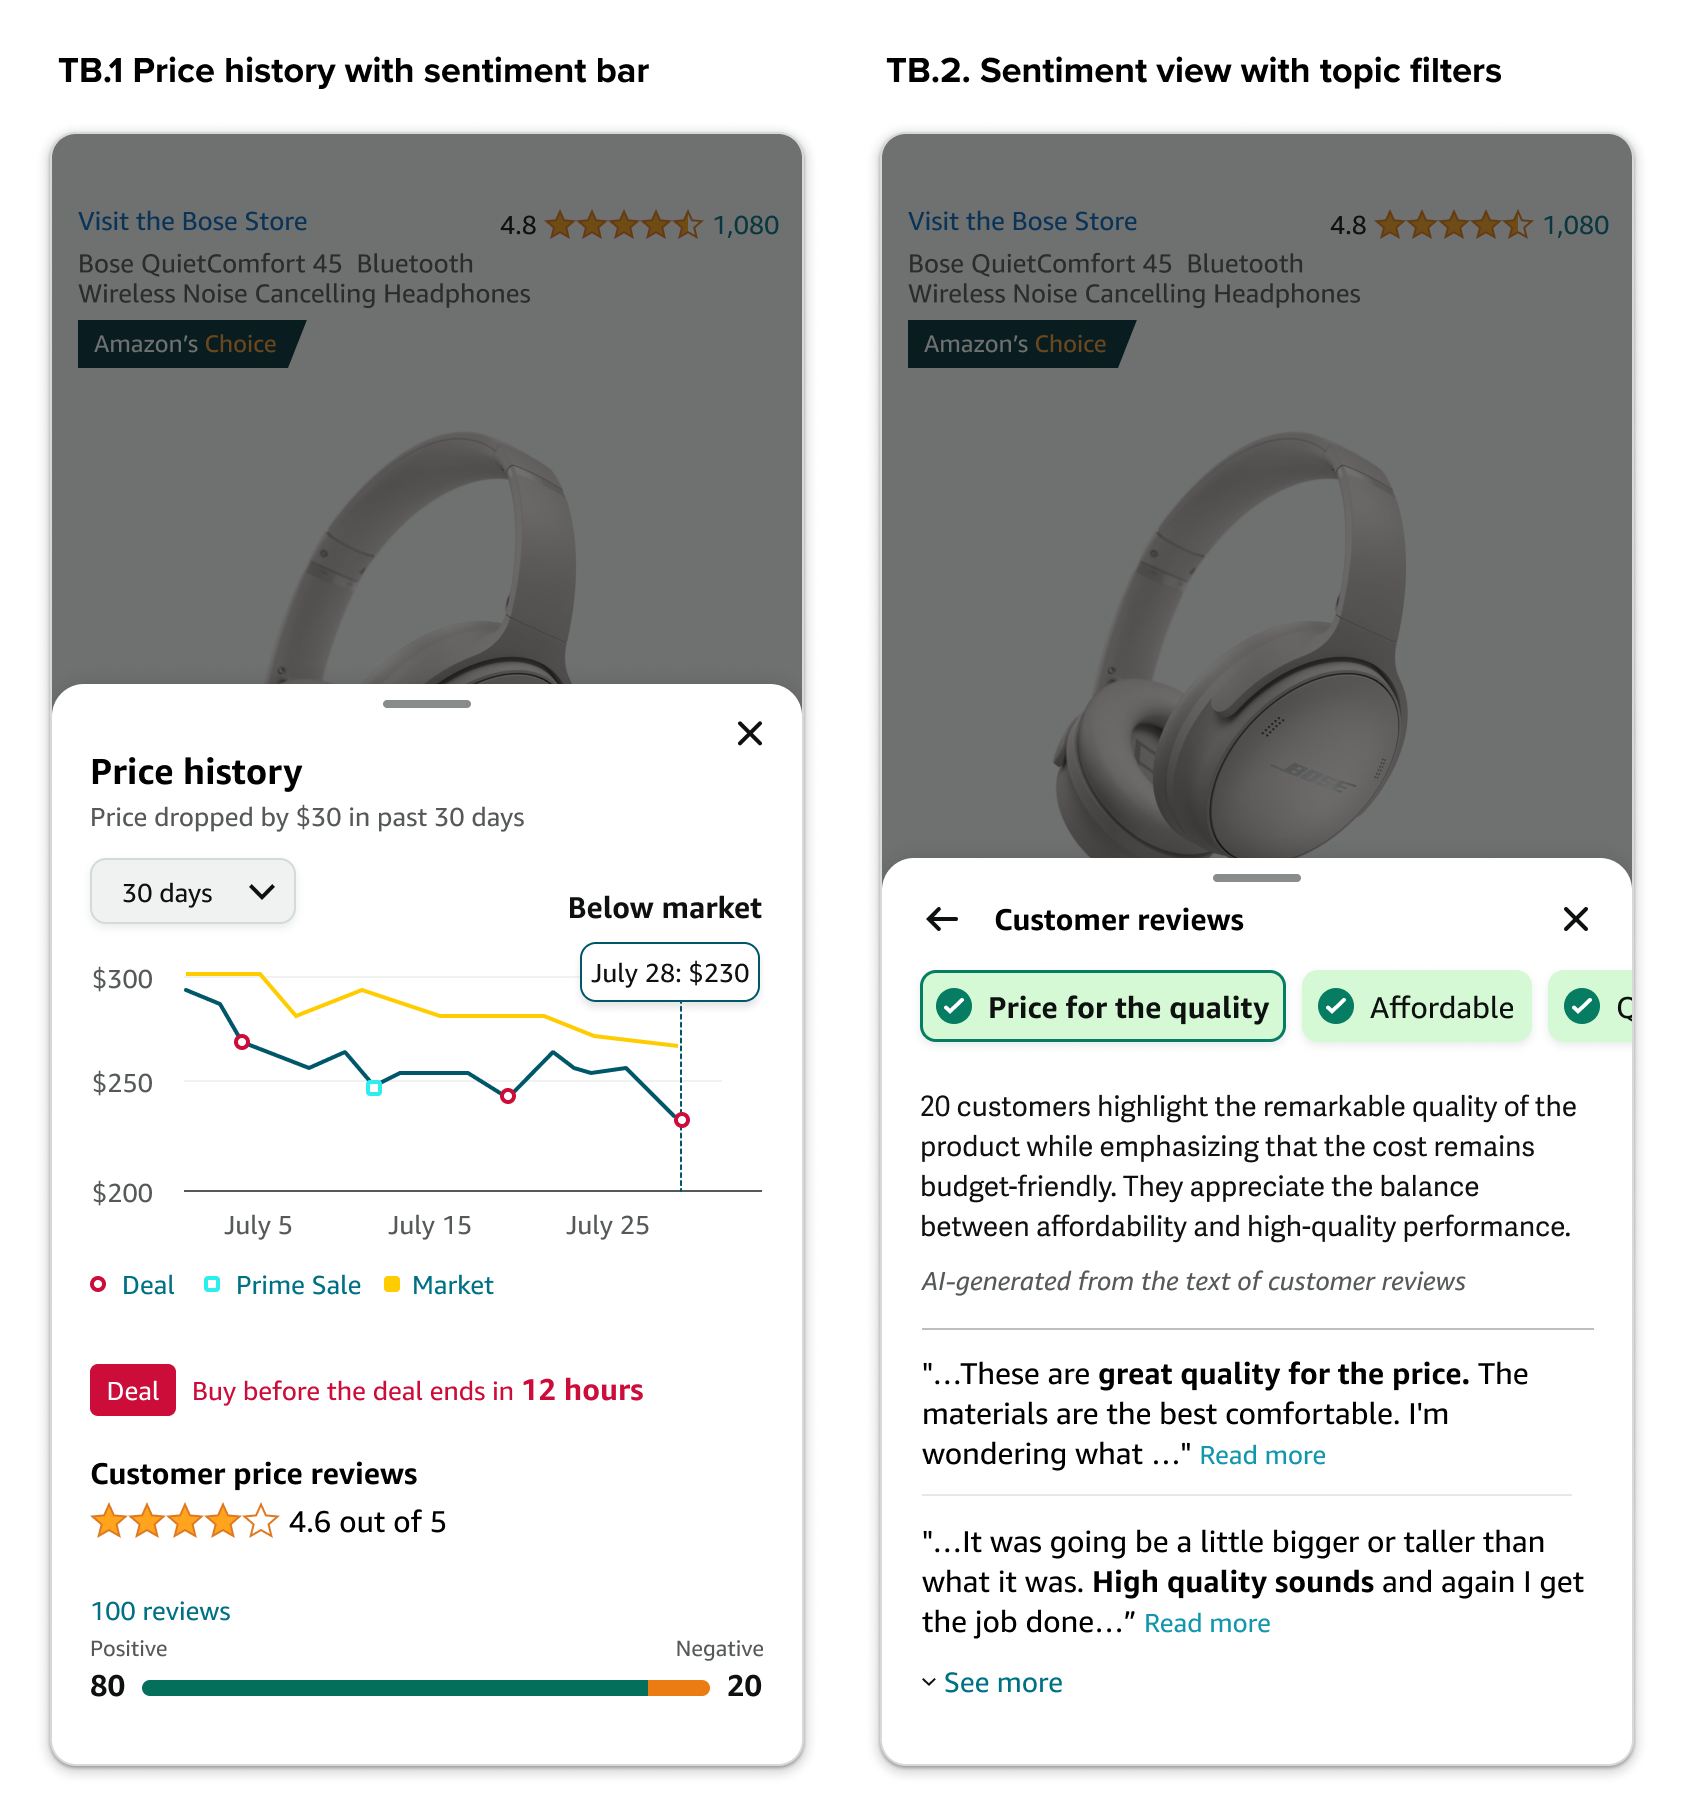
Treatment B
Showing overall positive/negative sentiment bar first
Providing topic filter buttons in the nested bottom sheet
Surfaces AI-generated summaries and corresponding customer reviews
Key Insights
8/10 found the combination of price tracker and price-related customer reviews useful for decision-making.
8/10 participants preferred a design that clearly displayed both positive and negative sentiment.
Looking ahead: measuring success
📈 Expected impact
For the first 3 months after launch, we measure success using three core metrics:
+45% improvement in self-reported price confidence
30–35% reduction in average decision time
Positive lift in conversion by reducing the high cart abandonment ratesn.